Figures for writing
Generating high-quality MATLAB figures for publication
Generating high-quality figures for documents — theses, papers — can be challenging. In general you will want to generate an image file from the figure window and then include that image in your document. Below are general notes with a Linux-specific example.
export_fig
The export_fig utility from the MathWorks File Exchange does most of the heavy lifting of saving high-resolution images from MATLAB figures. Download the zip archive and place it somewhere MATLAB can find the .m file — you can set the MATLAB path so that export_fig.m is always found.
Read the README and the File Information on File Exchange for documentation. In particular, you will need to install Ghostscript.
Example
% Set the default text sizes for the root figure
set(0,'defaulttextfontsize',20);
set(0,'defaultaxesfontsize',12);

% Set the background color to white
set(gcf,'color','w');

% Here is an example figure
figure(1);
clf();
plot(0:9,rand(10,1),'o-')
xlabel('Distance [m]')
ylabel('Force [N]')
legend('Data')
grid on;

% Now call export_fig to generate a png image file at 300 dpi
export_fig example.png -png -r300 -painters
If all goes well you will have an image file example.png in your working directory that looks like this:
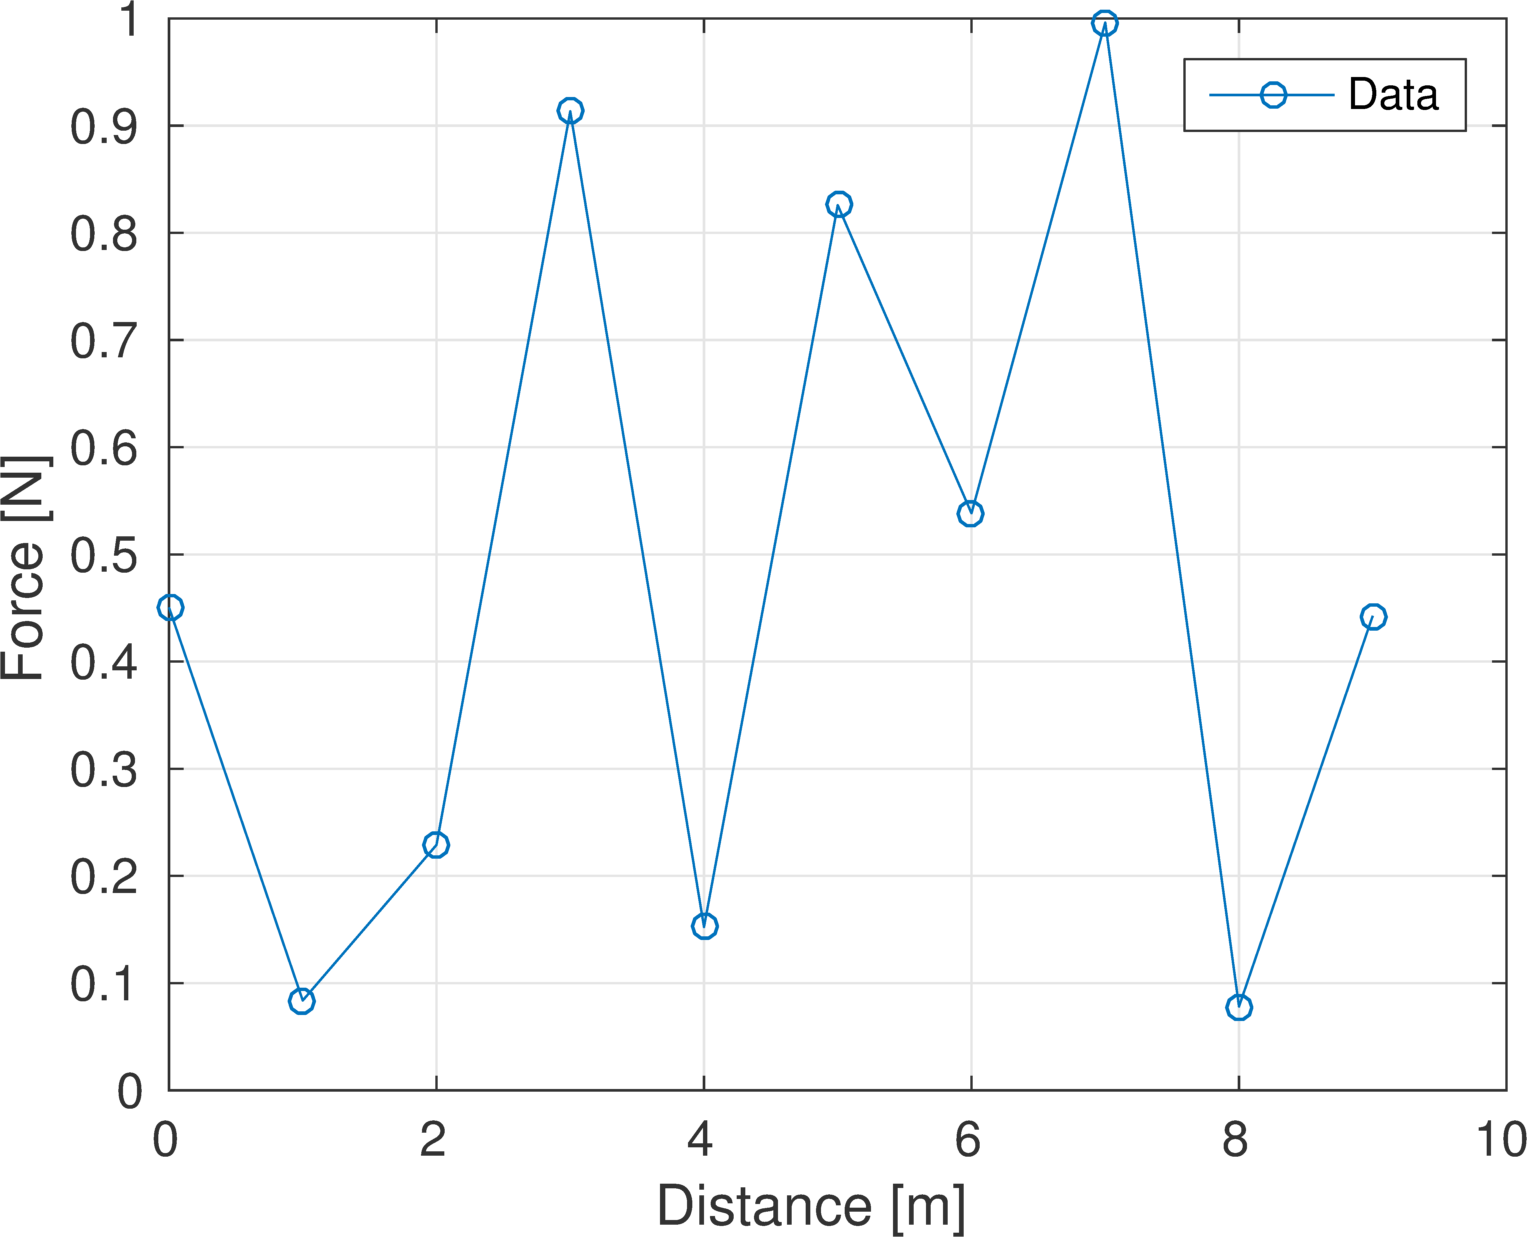
Note that the figure carries no title — the title belongs to the document, not the image. See technical writing notes for the distinction between figure titles and captions.
MATLAB wrappers
Personally I get tired of typing all of that, or putting it in every script, so I have convenience functions for creating figures for publication. They live in the frlbox repository; the figure export scripts — pubfig.m and exfig.m — are in figbox.